Past
Subjectivity - 1/10, the numbers are what they are. I think this is reasonably self evident. Each year/era comes with its own set of challenges and issues.
Predictive ability : 6/10, there’s a book I recently read called “How Not to Be Wrong: The Power of Mathematical Thinking” which discusses issues like mean regression in sports, stocks and all things in life. While we like to believe in things like momentum, ex. A player just hit 3 shots in a row, what are the chances he hits a fourth? The answer is, the chances he hits the 4th is equal to his historical shooting percentage. There are also large historical studies on poor performing companies versus “exceptional ones”, turns out over good companies underperform their historical benchmarks as
The benchmarks are unsustainable
Margins attract competition
After a horrific year, bad things are priced in, leaving a favorable risk reward scenario
Present
Subjectivity - 4/10. Similar to past the numbers are what they are, however if a company had a horrid year (ex, auto markers or advertisers in 2020) where earnings dropped 80% from $1 to $0.20, and in 2021 they increased 400% from $0.20 to $1 this company may present the illusion of being a growth stock.
Predictive ability 5/10 -
Accuracy - 8/10 - This is the most accurate measure of current stock price by my observation. When a company reports a 40% growth year, the market will tend to assign a high earnings. multiple between 30-50. When a company reports a poor year the multiple will contract to approximately the growth rate. (ex, Nvidia has grown at 70% over the last 15 months, the market has given them a 70x earnings multiple, more than 2x historical average, same applies to Apple, Microsoft, and Google who reported 25-35% growth rates.
Future
Subjectivity - 8/10.
Perpetual growth rate at a rate of 2% or 4% will make a very significant difference.
Discount rate makes a massive difference, 7% versus 10% can change the price target by almost double
Predictive ability and Accuracy 5/10 - Similar points to the above, most wall street analysts cannot predict prices and earnings 1 year in advance, with revisions between -20% to +20% regularly occurring in-between quarters. This is assumption is 2 fold:
Growth stocks - 2/10, Alibaba lies in this category, I will assume revenue growth at 15%+ to be in this category.
Slow growers 8/10, Banks insurers companies like JNJ, MMM, grocers, railroads, cigarette makers etc… One can calculate the current price reasonably accurately for these companies.
One more mor assumption*
I will be using the Peter Lynch Ratio and cash from operations (not EPS) which states:
Multiple = Cash from operations growth rate percentage (%)
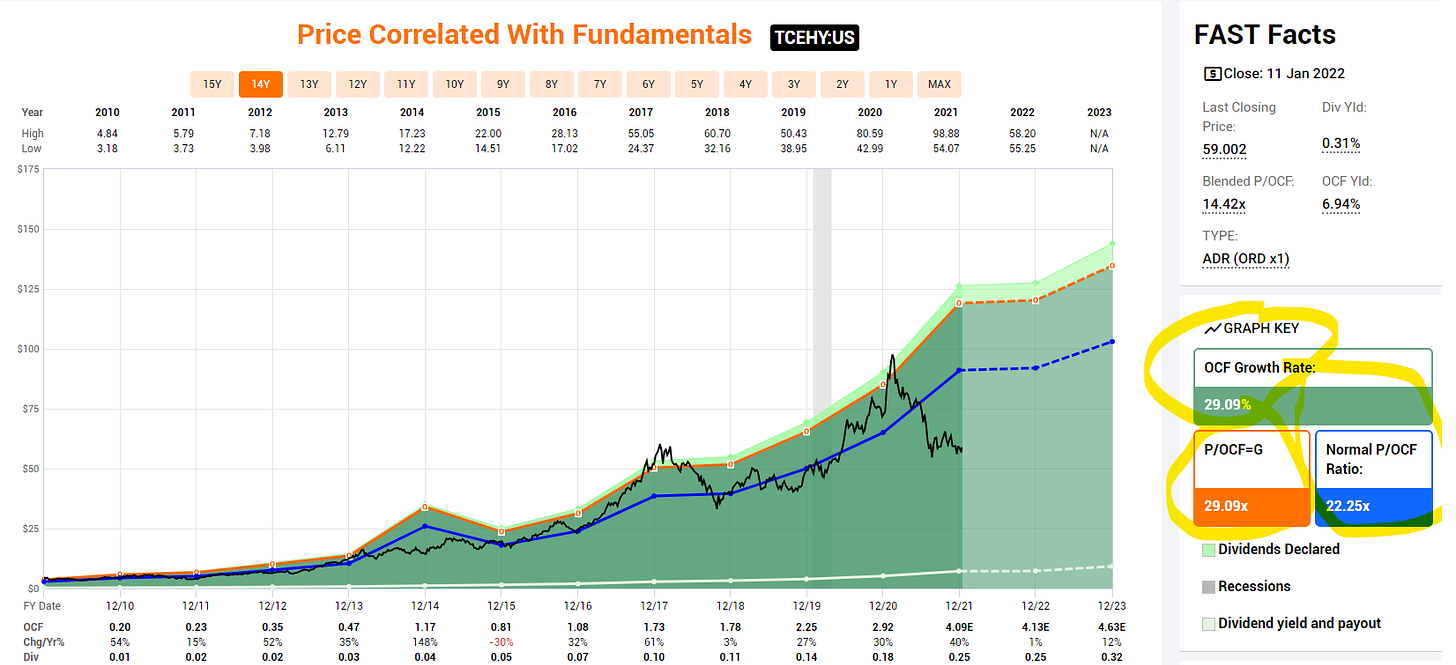
This is relatively simple however correctly captures a large % of data. The idea here is that if a company has grown cash flows for 20% for the last several years, the market will assign a 20x cash flow multiple for the price. Examples
Tencent:
Source : FastGraphs
Note the blue line represents the average multiple that the company has traded for in the market, the orange line represents the historical growth rate the market as a multiple. As Tencent has historically growth at 25ish percent, that has been the multiple assigned to it by the market. I also view Tencent as the best proxy comparison to Alibaba (Even more so than Amazon, despite the ecommerce and cloud) For the following reasons:
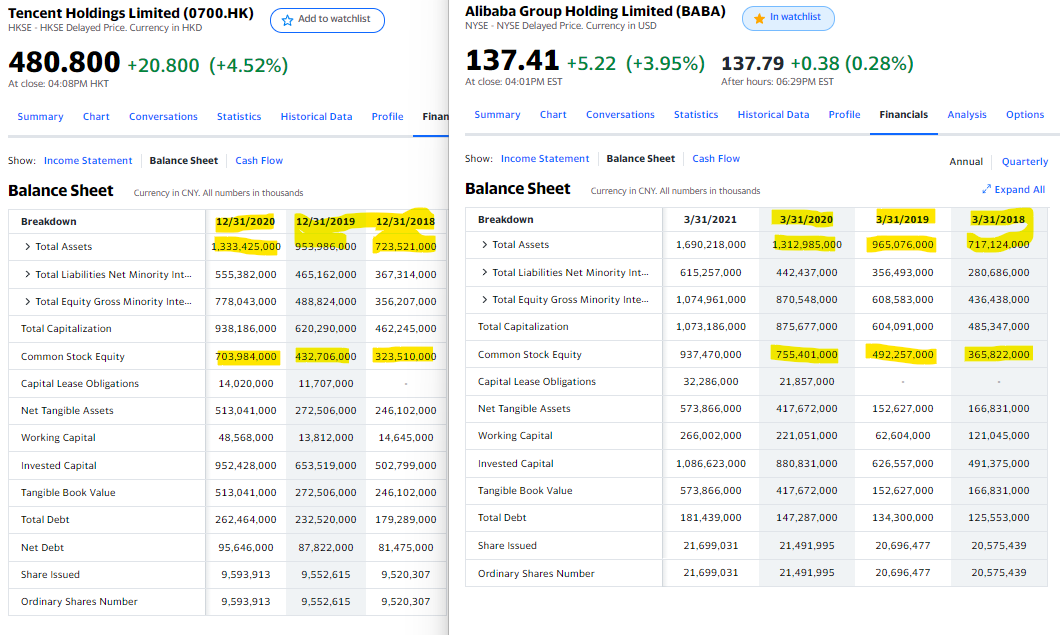
They operate in the same country and are subject to the Chinese regulators + government
Almost identical balance sheets
Amazon - Right behind Tencent as a proxy for comparison, while I like Tencent as the superior geo-business compassion, Amazon is the better operational business comparison.
Source : FastGraphs
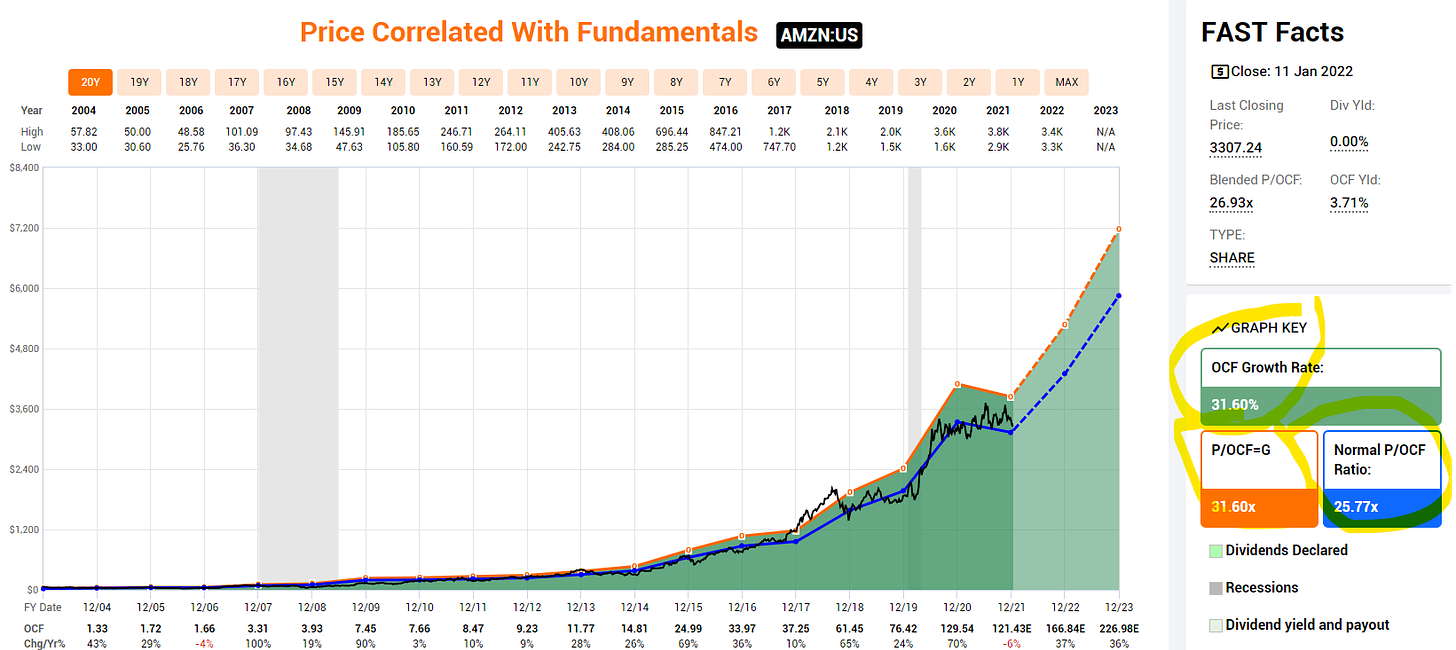
Note both Tencent and Amazon trade at a slight discount to their Orange Line (growth rate * Cash from Operations, in this case 31.60 * any years cash from operations). This results in a WACC value of 8.4% for Amazon. Additional note, like Alibaba (in below picture), Amazon had a decline in cash from operations in 2021.
Now that the framework is setup lets begin.
Past - Alibaba
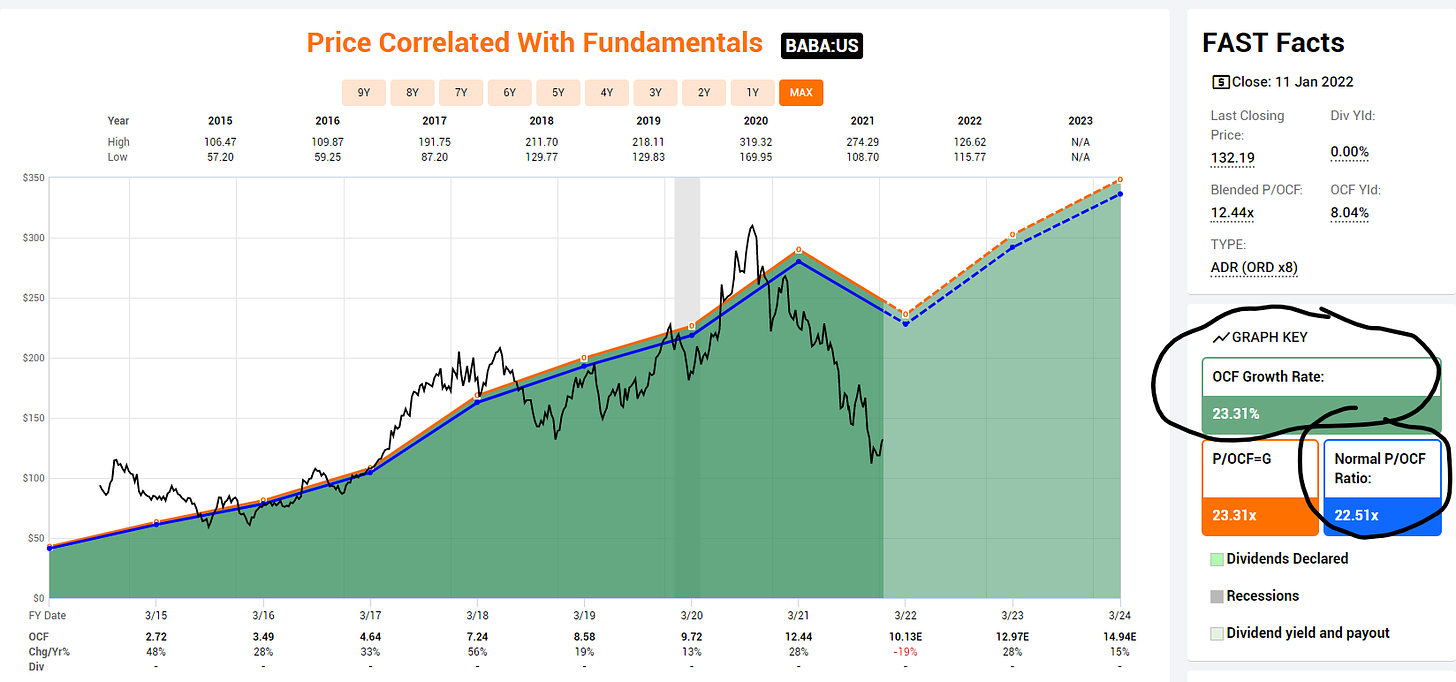
We have a historical growth rate of 23.31%. This is lower than Tencent and Amazon because it does not contain data from 10-20 years ago where they posted growth rates of 50%+.
Cash from Operations in 2022 = $10.13
Historical Growth Rate = 23.31%
Peter Lynch Ratio = 10.13 * 23.31 = $238.46
Adding assets (from below)
= $238.46 + $66.4 = $304.86
Present - I will break this down into 2 components: assets and cashflows.
a) Assets
-
The below is a compilation of the largest public assets owned by Alibaba. Over the last three years they have made between 50-100 investments per year, the largest components are captured here and the remainder are grouped in the last row via “Other Missing”. This was made via me the companies in yellow are private and I have sourced valuations during the most recent funding round. The non yellow ones update live with ticker symbols on the left.
Link Source
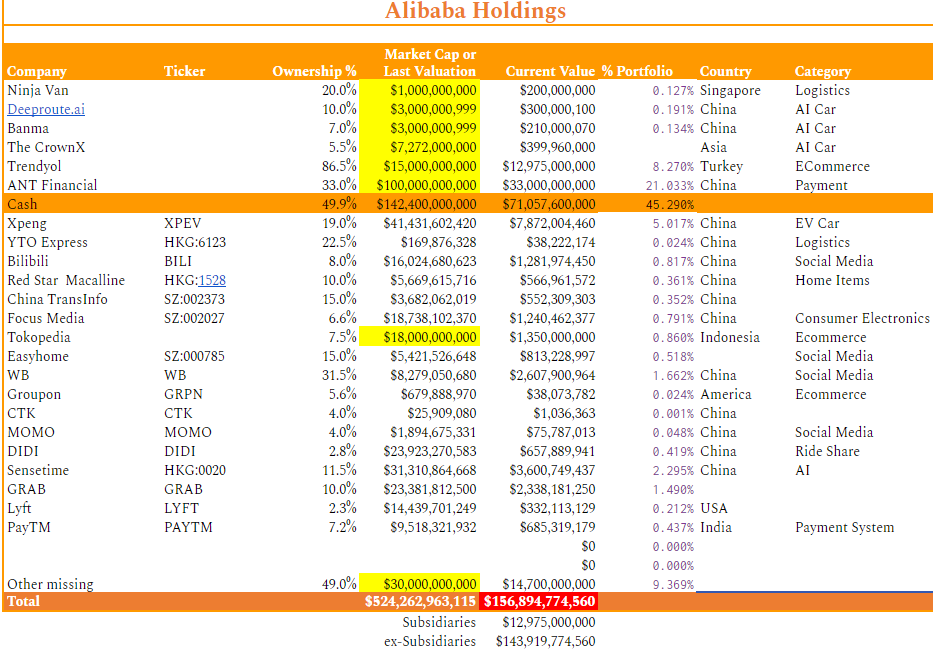
Ant Financial. Alibaba’s largest asset, I have used 100b market cap versus the 300b IPO target in 2020, as all Chinese tech are down minimum 50%, with ANT having to restructure their most profitable consumer lending division. Thus I view a 66% trim as reasonable.
Asset value = 144billion / 21,699,031 shares (2nd last line in balance sheet)
=$66.4/share. At the same time, Alibaba's DCF valuation shows that its value is close to the market value.
b) Cash from Operations (OCF)
The number from historical is equal, however as this is present we will not use the historical growth rate. Instead I will use the growth rate from the most recent “Singles Day”, which was 8.5%. This represents the most recent public data and occurred after 2021 Q4 report
Using Peter Lynch Ratio : 8.5 * 10.13 = $86.11/share. This agrees with the intrinsic value of Alibaba that we calculate
Finally, adding a and b
= $66.4 + 86.11 = $152.47
Sentiment
Sentiment can be the primary determinant of short term (present) prices, and can over-ride any valuation metric. The current Chinese Sentiment is close to 1/10, apart from direct war it’s difficult to think of how relations between China and USA can further deteriorate. Thus according to mathematical regression, as things go from terrible to normal, they will appear to be improving.
Sentiment Case: Luckin Coffee
Luckin Coffee went IPO April 2019 for a price of $17 a share. At the time revenue growth was “reported” at 40%. Turns out the CFO over-represented growth rates, while the company was expanding operations it was not as posted numbers. LK was de-listed, will be permanently labelled a “fraud” in the eyes of the public, and the price plummeted from a peak of "$50 to $0.79.
Fast forward 2 years, in the middle of the largest crackdown in Chinese stock history, LK passes it’s IPO price in the pink sheet market.
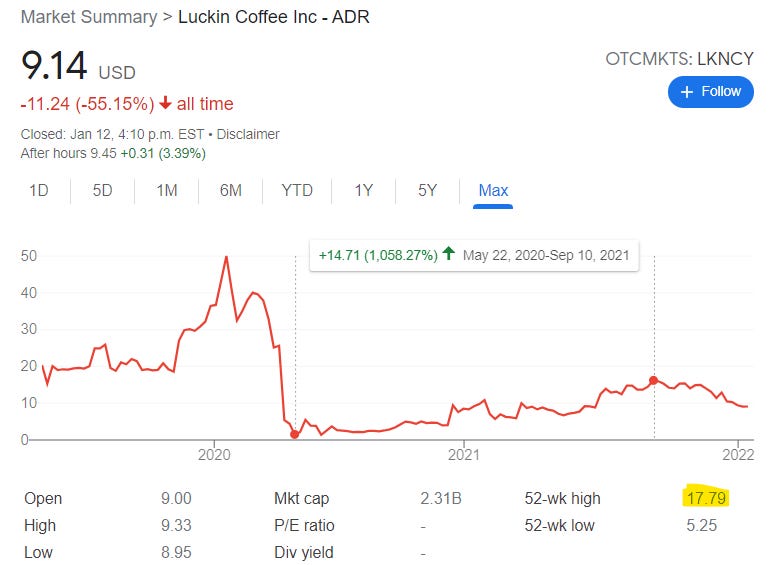
Alibaba is not LK, it’s been run like a global conglomerate + Chinese Flagship tech company from day one. If Luckin Coffee can recover... anything can.
Future
This is arguably the most volatile (and worst, also most common…) metric to valuate a company, as small changes to assumptions can have very significant impact.
I will try to minimize this using a 2-year forward earnings estimate. I expect the margin of error to be between -30% to +30% (where I expect a 10 year to be around -50% to 100%).
Using value investing frameworks, analysts tend to on average do a reasonable job for 1 year projected earnings, that said two years ago Alibaba was expected to make $14-15 in cashflow per share in 2021, it has made $10). Additional things to consider
China is currently in a significant recession via deleveraging. Real estate has taken a huge hit, overleveraged builders are not longer allowed to burrow until they get below a certain leverage threshold. ANT was forced to re-structure its lending business, thus 2020 was a year where consumers were making leveraged purchases, and 2021 the same consumers were slightly more price sensitive + less leveraged. Thus comparing 2021 to 2020 is irrational, however 2022 versus 2021 will be closer to apples to apples
Alibaba in the most recent report was slapped with a income tax increase from 12% to 24%. This is very significant as all things equal, earnings over previous years quarter are 12% lower, and thus must grow 14% just to match last years numbers. We won’t get apples to apples comparison until Q4 2022, as the next 3 quarters will be comparing higher tax rate to lower tax rate. While tax is not covered in CFO, such a large expense will materially affect managements operational decisions.
Significant investment increase in Lazada (Shopee competitor) and Taobao Deals (Pinduoduo equivalent)
That said, the expected CFO is $14.94/share
Once again, using Peter Lynch Ratio
$14.94 * 23.31 = $348.25
Discounting back 2 years at a 10% discount rate (SNP500 historical return as opportunity cost):
$348.25 / 1.1^2 = $287.81 today
Adding back assets : $288 + $66 =
$354.21
Three methodologies, three valuations
Past : $304.86
Present : $152.47
Future : $354 .21
What does this tell us about Alibaba, is it over-valued, undervalued or fairly priced? I think this exercise tells us more about the market and sentiment than it does about Alibaba. Warren Buffet describes the market as a “Manic Depressive” that changes it mind as the wind blows, he has been saying this for about 50 years. A good example of this is NVDA and their most recent 70% growth beats
Source : FastGraphs
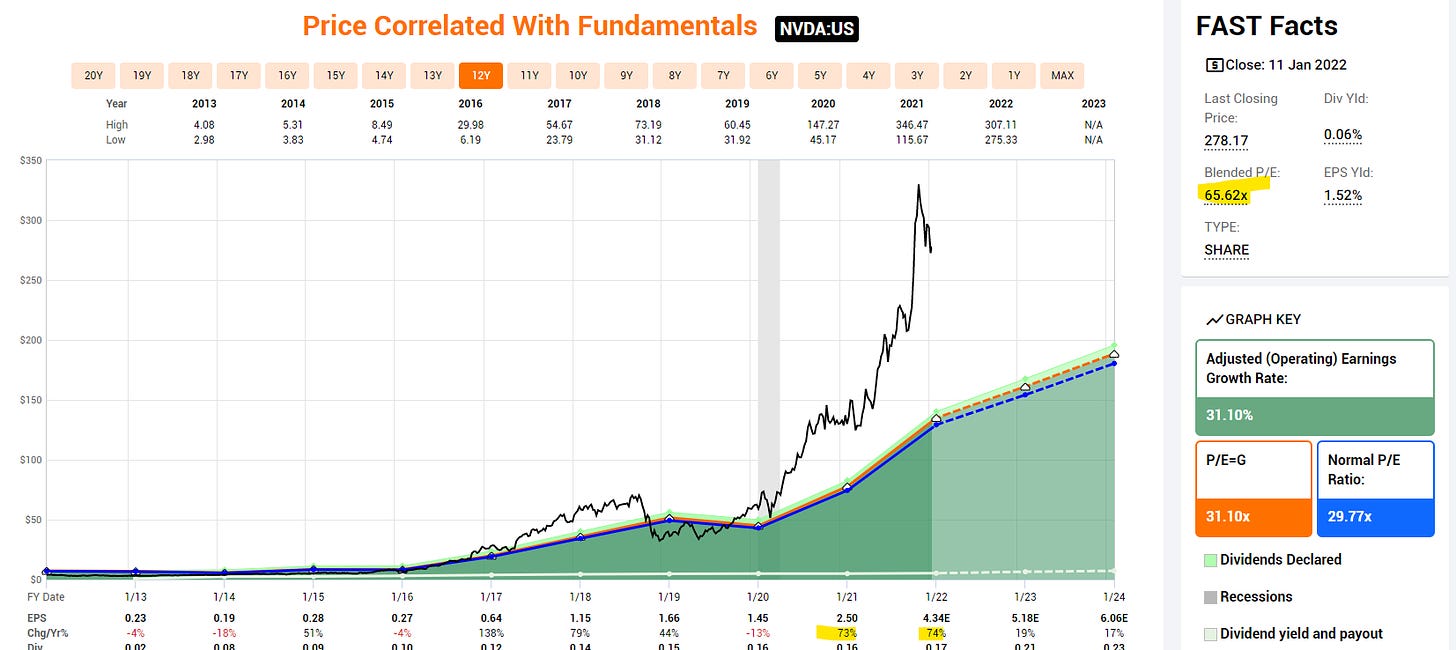
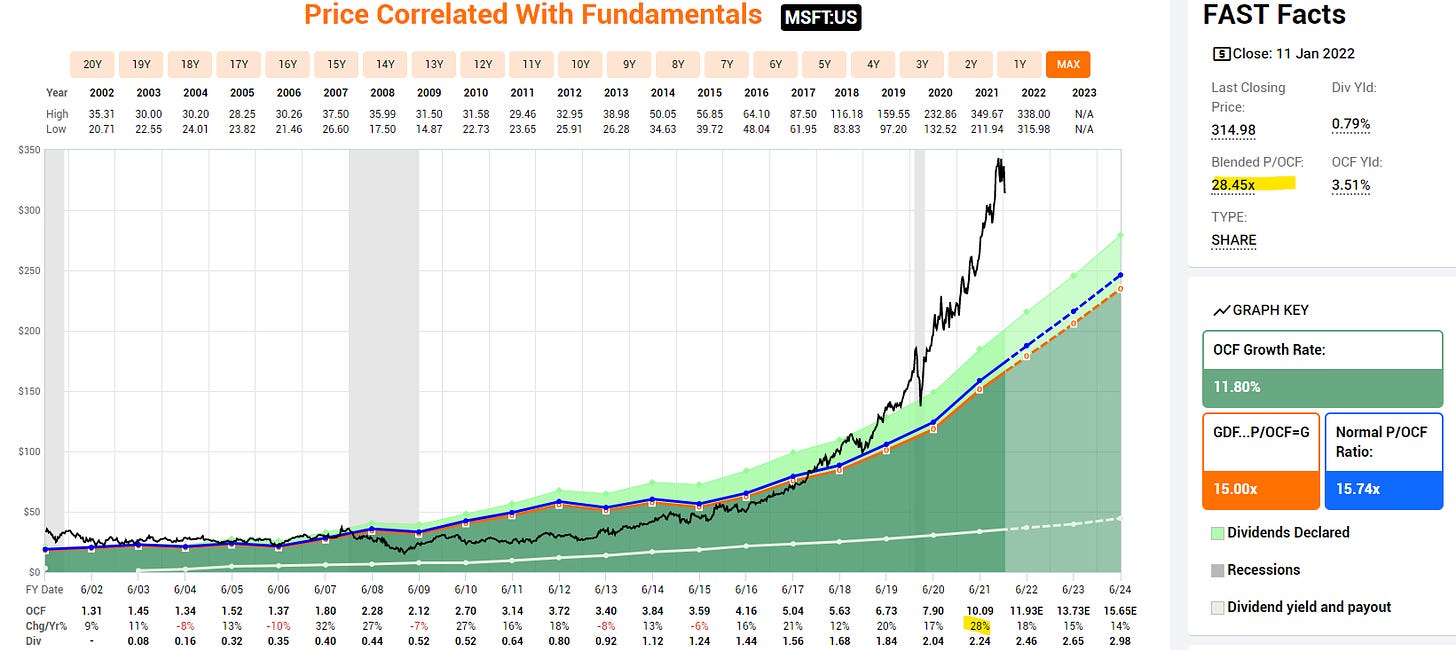
One cannot expect a 700b market cap company to grow at 70% over a prolonged period of time, however they posted 70%, and the market gave them a 70-80x multiple. If that number slows down to 30% in the future (despite the 19% prediction), the price will be cut in half, if NVDA indeed hits 19%, we are going to have a violent game of musical chairs. Examples like this can be found in all stocks regardless of size including MSFT
Source : FastGraphs
Conclusion
At the time of writing, Alibaba’s price is $137, this represents a 11% discount to the “present” value by the best stock research websites , and over 120% discount using past and future valuation metrics. This exercise also suggests the market is “present” thinking and significantly over-reacts to both good and bad news. If Alibaba indeed posts a 28% growth rate in 2022 at $13 cash flow / share, that implies a price of $400+ ($13*28 operational value + $64 assets), which seems impossible given the current sentiment and valuation levels. Time will tell how this plays out, in the meantime I am long BABA.